Activity Log
The Clinical Office:MPage Edition activity log offers extensive debugging options in your MPages including queue activity monitoring, data service content review and error reporting.

Setup
By default, your project template will have the activity log enabled. The activity log component is configured by a combination of setting the enableLog parameter to true in the setMaxInstances method of the mPageService and by adding the <mpage-log-component> to your app.component.html file.
Version V4+ introduces an optional displayInline boolean parameter that changes the display behaviour of the activity log. Instead of overlaying the bottom section of your MPage content, setting displayInline to a value of false results in the log displaying below your MPage content.
e.g.
<mpage-log-component [displayInline]="true"></mpage-log-component>
Disabling the Activity Log
The ie-mpage and edge-mpage GitHub templates are pre-configured with the activity log turned on. If you wish to disable the log, simply set the enableLog parameter to false in the setMaxInstances method of the mPageService. You can also optionally remove the <mpage-log-component> from app.component.html however this step is not needed.
this.mPage.setMaxInstances(2, false, 'CHART');
* We highly recommended that you keep the activity log enabled on your MPages as it is an invaluable tool in diagnosing production issues that may come up with your MPage. The log keeps the last 100 transactions in memory and clears older values as new ones are added to keep memory usage down. Training your helpdesk to have users open the log and send print screens will greatly reduce your debugging time.
Showing/Hide the Activity Log
Opening and closing the activity log is done by holding the CTRL and / buttons at the same time.
Activity Log Sections
The activity log is divided into three sections. The top section represents the header and acts as a separator between your MPage content and the activity log content. It also displays a simple count of any detected Angular or JavaScript errors as well as the name of the current patient if the MPage is set to run at the chart level. Below the header section you will find the options and results section. The options section is where you choose the type of activity you wish to view in the results section.

Testing Your MPage With Different Visits
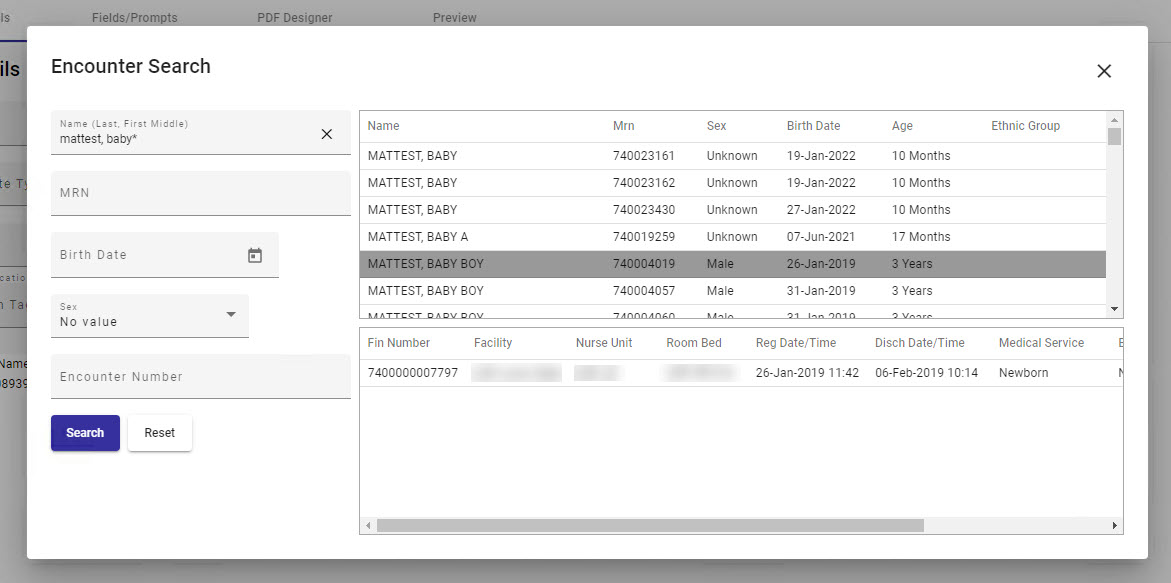
While developing your MPage you will often want to test your MPage with one or more visits. If your MPage is set to 'CHART' mode and is being run from anywhere other than PowerChart (e.g. Developer Proxy, Discern Visual Developer, etc.) you can change the patient by clicking on the name of the patient in the top right corner of the log. Doing so will present you with an encounter search window where you can assign a new visit.

Once you have chosen your new visit, you will be given a 5-second warning in the log before your page refreshes with the new visit information. This visit will remain active in your MPage until changed. Regardless of the value set, PowerChart will always use the visit selected inside PowerChart and ignore the log set values.

Option/Result View Types
| Option Type | Description | Sample |
|---|---|---|
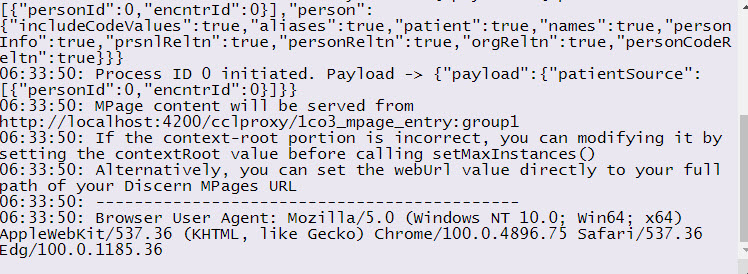
| Activity Log | Displays activity as it happens with time stamps starting with connectivity and browser agent information. Any Angular/JavaScript errors, CCL call submissions and putLog calls you issue are recorded in the activity log. |  |
| Queues |
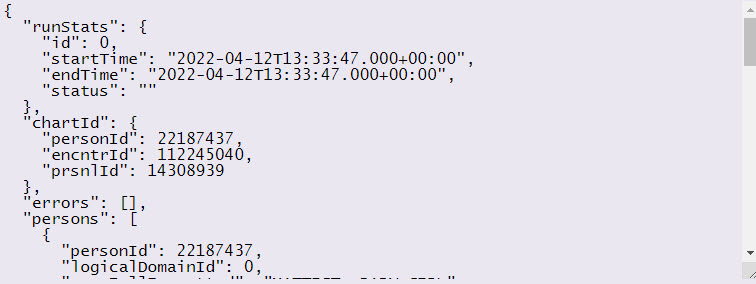
Each instance assigned in your mPageService.setMaxInstances method will be shown as an instance number on the activity log. Clicking the name of the instance will show the results of the last call to the instance. Along with your service activity data, this includes statistical information such as start and end time as well as any CCL errors that may have occurred. In addition to the queues, a counter of the number of queued tasks waiting to run is also displayed. |
 |
| Data Services |
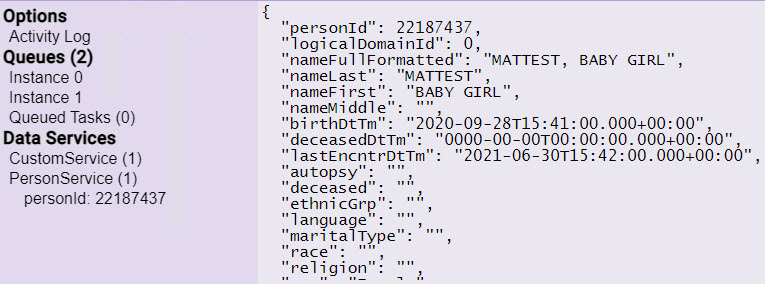
All Clinical Office data services are available to be inspected through the activity log. Each service that contains data is displayed in the Options window along with a count of the number of records loaded for each service. To view the content of a record, click the name of the service to expand the list of records. Navigate to the record you wish to inspect and left-click on it to see the entire content of the row in the results view. |
 |
